Perc Pineda, PhD
Chief Economist, PLASTICS
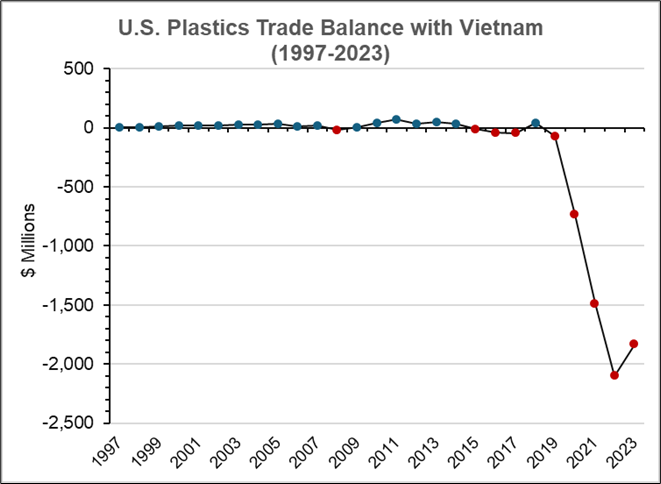
The 2023 edition of the Plastics Global Trends Report, an annual publication by the U.S. Plastics Industry Association, highlights a $1.8 billion U.S. deficit with Vietnam in plastics, which consists of the four main components of plastics manufacturing—resin, machinery, molds, and plastics products. The deficit stems from $2.5 billion in imports from Vietnam compared to $649.5 million in U.S. exports to Vietnam.
Vietnam ranks as the 19th largest export market for U.S. plastics. However, it is the 8th largest source of plastics imports into the U.S. in 2023. Specifically, in plastic products, Vietnam ranks as the 4th largest import source, following China, Mexico, and Canada, and surpassing South Korea and Taiwan, both of which have significant shares in the U.S. plastic products market. Last year, imports of plastic products alone from Vietnam totaled $2.3 billion.
From trade surplus to trade deficit
Historically, the U.S. maintained a trade surplus with Vietnam since 1997, with a few exceptions. The first recorded trade deficit occurred in 2008, totaling $18.0 million. This was followed by a return to surplus over the next six years. However, in 2015, the U.S. recorded another deficit of $12.0 million, which increased to $41.1 million in 2016 and $45.6 million in 2017. After 2017, the U.S. once again achieved a trade surplus, with a peak of $43.3 million in 2019. This surplus, however, was short-lived. Since 2019, the U.S. has consistently recorded a trade deficit with Vietnam.
Historically, the U.S. maintained a trade surplus with Vietnam since 1997, with a few exceptions. The first recorded trade deficit occurred in 2008, totaling $18.0 million. This was followed by a return to surplus over the next six years. However, in 2015, the U.S. recorded another deficit of $12.0 million, which increased to $41.1 million in 2016 and $45.6 million in 2017. After 2017, the U.S. once again achieved a trade surplus, with a peak of $43.3 million in 2019. This surplus, however, was short-lived. Since 2019, the U.S. has consistently recorded a trade deficit with Vietnam.

Growing influence in U.S. and global plastics market
Vietnam’s Growing Role in U.S. Plastics Trade: From Surplus to DeficitWhile Vietnam’s economy, at $418.9B in nominal gross domestic product (GDP) in 2023, is comparatively smaller than other countries with which the U.S. maintains a trade deficit—such as China ($17,488.2B), Germany ($4,517.6B), South Korea ($1,139.1B), and Taiwan ($755.7B)* —its share of the U.S. plastics market has grown by 31.0% CAGR over the past ten years.
While the U.S. is the world’s largest market and one might assume that Vietnam’s significant increase in plastics exports is primarily directed toward the U.S., however data reveals that Vietnam is, emerging as a global player in plastics trade.
In PLASTICS’ annual Global Plastics Ranking®, an annual ranking by PLASTICS on the key players in the global plastics trade, Vietnam has made significant strides over the years. In 2018, when PLASTICS launched its ranking of countries by trade volume across all key plastics industry supply chain components—resin, machinery, molds, and products—Vietnam was ranked 24th. In 2023 it has moved up to the 18th spot – a position it has kept since 2022 – surpassing Saudi Arabia – a world leader in plastic materials and resin.
Competitive edge in the U.S. plastics market
The share of plastics from Vietnam in the U.S. market is expected to grow. The strength of the U.S. dollar and Vietnam’s competitive labor costs provide a significant comparative advantage, particularly in plastic products. Industry estimates indicate that the average monthly income in Vietnam was $291.34 in 2023.
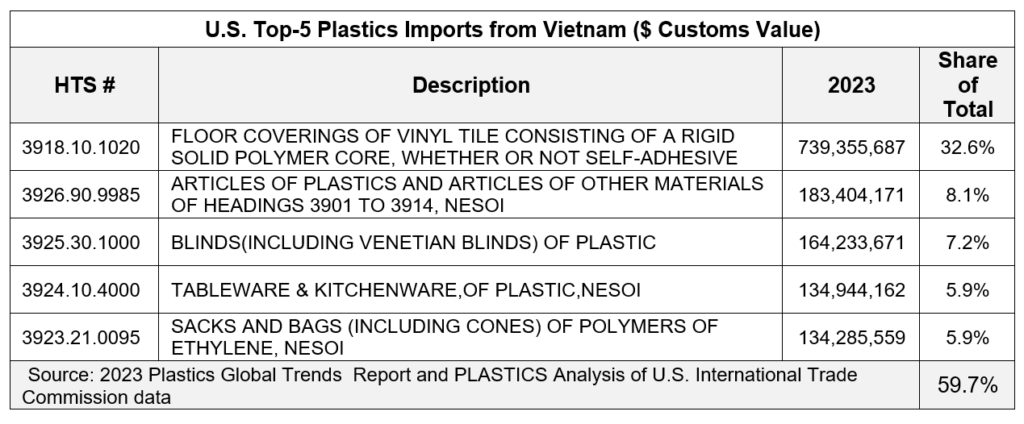
Vietnam’s proximity to China offers a strategic advantage for Chinese exporters seeking to outsource manufacturing. This also facilitates access to plastic materials and resin from China, particularly polymers of propylene, styrene, and vinyl chloride. In 2023, more than half of U.S. imports from Vietnam were concentrated in five key products, with vinyl floor coverings comprising 32.6%, as shown in the table below.

This article is an excerpt of a PLASTICS’ Economics and Industry Research forthcoming white paper discussing factors contributing to the persistent rise of imports of plastics products from key Asian countries into the U.S. market. PLASTICS members will be notified when the white paper is available through the monthly PERC Report.
[*] See 2023 Plastics Global Trends Report. https://www.plasticsindustry.org/data-analysis-reports/global-trends/. South Korea and Taiwan 2023 GDP at current prices are from the International Monetary Fund.