By Perc Pineda, PhD
Chief Economist, PLASTICS
The U.S. economy demonstrated resilience throughout the first half of 2023; however, a mixed outlook remains. The real gross domestic product (GDP) displayed growth rates of 2.0% and 2.4% in the initial and second quarters, respectively, defying previous concerns of a recession this year. Nonfarm employment figures increased by 1.6 million during the first six months of the year, although this uptick was lower than the 2.7 million recorded during the same period in the preceding year.
Despite the positive indicators, the labor market exhibited signs of cooling in June, raising questions about the influence of the Federal Reserve’s contractionary monetary policy on the U.S. labor market. The Federal Reserve’s decision to implement a 550-basis points adjustment on the economy seems to have an effect in managing inflationary pressures. Notably, headline inflation, measured by the year-on-year change in the Consumer Price Index (CPI), stood at 3.1% in June. Meanwhile, core inflation, which excludes volatile food and energy prices, reached 4.9% in the same month.
However, both headline and core inflation experienced an increase in July, reaching 3.3% and 4.7%, respectively. These higher inflation rates in July immediately impacted Wall Street’s main indices, leading to a decline upon the public release of the new inflation figures.
Macro and Micro Data Divergence
The divergence becomes more pronounced when transitioning from aggregated macro data to industry-specific data. Of particular significance is the evident split in business activity growth rates between the manufacturing and services sectors. The Institute for Supply Management (ISM) monitors both sectors’ activities, which have been following divergent paths. Notably, the ISM Manufacturing PMI® has seen nine consecutive months of contraction. It was 46.4% in July. A reading of 50.0% indicates manufacturing contraction. In stark contrast, the Services PMI® from ISM has recorded seven straight months of expansion, reaching 52.7% in July. The services sector has sustained growth in 37 out of the last 38 months, with only December 2022 standing out as an exception.
Another manufacturing indicator, the Gardner Business Index (GBI) for overall plastics processing, sustained contraction through June. The GBI has remained under 50 consistently over the last year, signifying contraction.
Consumption Patterns Tell the Tale
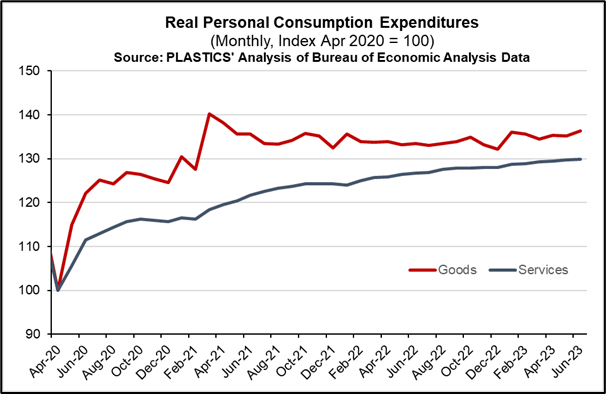
When scrutinizing consumption data, the contrasting growth patterns of the manufacturing and services sectors become even more apparent. Examining monthly data from January 2002 onwards, prior to the COVID-19 recession, goods consumption constituted an average of 44.0% of total personal consumption expenditures (PCE), while services made up 66.0%. The lockdowns and closures experienced by numerous service industry segments caused a shift in the distribution of goods and services consumption. Since the conclusion of the COVID-19 recession in April 2020 up to June 2023, goods consumption has averaged 40.0% of PCE. In the past 16 months, goods consumption accounted for 39.0% of PCE, with services at 62.0%. Clearly, the pandemic’s effects persist in the economy. This suggests room for increased services consumption, while goods consumption may continue to decline

Addressing the Goods and Services Consumption Gap
The improved consumer sentiment, reflected in the University of Michigan’s Index of Consumer Sentiment having registered 72.6 in July compared to 51.5 in the same month the prior year, can be attributed to reduced inflationary pressures and a robust labor market. The sustained rise in Personal Consumption Expenditures (PCE) directed towards services can be tied to consumers’ increased engagement with the services sector of the economy, while their emphasis on the goods sector seems to have diminished. This shift in consumer preferences contributed to the downturn observed in the manufacturing sector.
The divergence in consumption patterns is further underscored by the accompanying chart, highlighting the shift in consumer behavior and its potential implications for a plateau in manufacturing activity. PCE on goods surged 40.0% in March 2021 from April 2020, after which the trend flattened. In contrast, PCE on services only peaked in June this year, increasing by 29.9% since the end of the COVID-19 recession.
Anticipating Continued Rebalancing
In summary, it’s worth noting that the U.S. economic trajectory, post-pandemic, has shifted from heightened goods consumption driving manufacturing activity to a stronger emphasis on services consumption. This change in consumer preferences has resulted in a slowdown in the demand for goods, particularly non-essentials, leading to a corresponding decline in manufacturing activity.
On August 11, 2023, the Federal Reserve Bank of Philadelphia’s Survey of Professional Forecasters for the third quarter 2023 was released. Forecasters revised their outlook for the U.S. It is now expected that the U.S. economy will grow 2.1% this year and 1.3% next year. Unemployment is now expected to average 3.6% in 2023 and 4.0% in 2024.